Last year, I wrote about a project I’d developed at Sadler’s Wells to improve how we collected and analysed audience survey data.
The project started because I was frustrated with some of the limitations of the audience surveying platforms available to cultural organisations. We were asking audiences questions we already knew the answers to, spending time administering surveys, and not always getting the most useful information back.
I thought we could do better.
So I built an alternative, using Tessitura, WordFly, Jotform, Power Automate and Power BI. It worked well, and went considerably further than I’d originally intended!
Since then, I’ve left Sadler’s Wells, moved to Canada, and established my own data and analytics consultancy. I’ve also developed Datarelle, a platform for bringing together data from different sources to provide organisations with a more complete picture of their activities and audiences.
I’ve been revisiting the original audience survey work, including bringing some of the Sadler’s Wells survey data into Datarelle. It’s a useful example of how my approach has developed, what I’d do differently today, and how the same principles can be applied to other organisations.
Where it started
The original problem was straightforward.
Like many cultural organisations, Sadler’s Wells needed to understand who was attending its performances, what audiences thought of their experience, and how those audiences compared with the wider population. Audience surveys were an important part of that. But the available systems had some frustrating limitations.
For example, someone would receive an email thanking them for attending a particular performance and inviting them to complete a survey. They’d click through, only to be asked which production they’d seen, and on what date.
We already knew that. It was how we’d selected them to receive the email in the first place!
Asking again introduced unnecessary work for respondents and an opportunity for errors. There were other limitations, including administrative overhead, restrictions on how surveys could be presented, and limited flexibility over the questions we could ask.
So I developed an alternative.
WordFly used data from Tessitura to send survey invitations, including information identifying the performance. Jotform captured the responses, Power Automate handled the subsequent processing and enrichment, and Power BI provided the reporting.
This meant we could present surveys with the right information already attached, change questions according to the circumstances, and offer respondents the option of submitting a partial survey rather than abandoning it entirely.
We could also do something particularly useful with the results: combine them with other data.
You can read more detail in my original post: Improving Audience Surveys for Cultural Organisations.
Collecting responses is only part of the challenge
One of the most useful aspects of the original project wasn’t the survey itself. It was what happened once we had the responses.
By including the performance details in the personalised survey URL, we could be confident that each response related to the correct performance. Respondents didn’t need to enter or select that information themselves, removing a potential source of errors and improving the accuracy of the data we collected.
This also gave us a better way of looking at response rates.
A conventional email survey platform might tell you that 10% of the people who received an invitation completed a survey. But that doesn’t tell you what proportion of the audience responded.
Not everyone attending a performance will receive a survey invitation. Group bookings and tickets sold through agents, for example, can account for a significant proportion of the audience.
By connecting the responses to performance and attendance data, we could calculate a response rate based on the audience in the auditorium, rather than just the email recipients.
Other data sources
We could then go further.
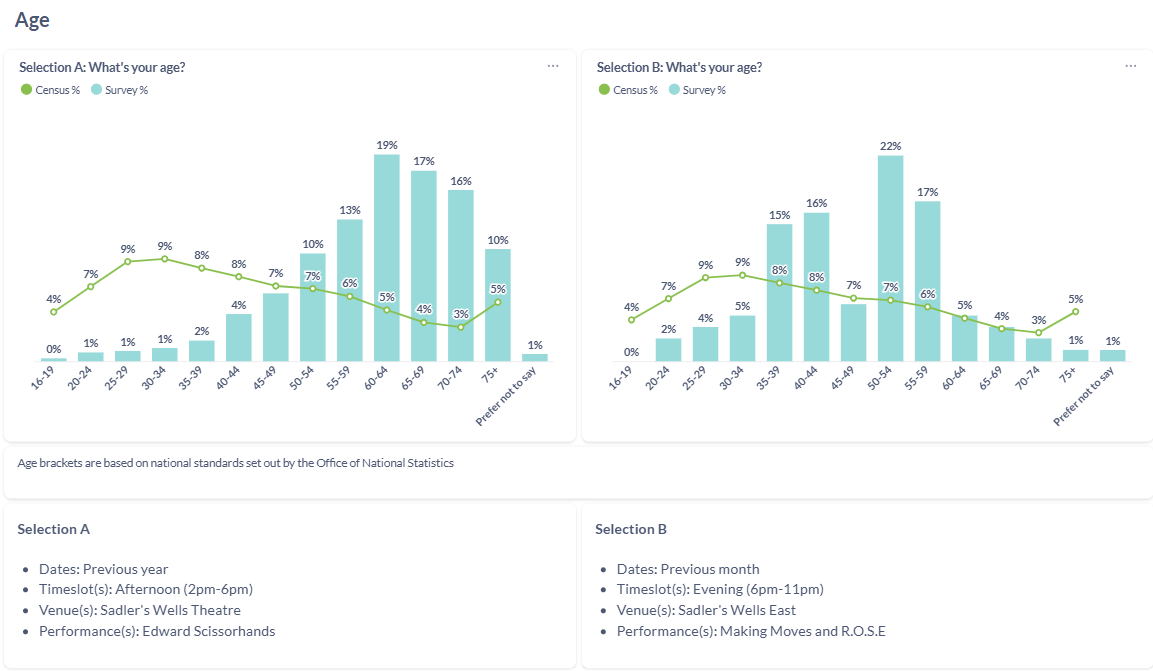
We combined demographic responses with data from the 2021 UK Census, allowing us to compare the characteristics of survey respondents with those of the population in London, or within particular local authorities (or groups of local authorities).
A chart showing the age distribution of survey respondents is interesting. Showing that distribution alongside the population of the area you’re trying to serve gives it considerably more context.
Of course, survey respondents aren’t necessarily representative of the whole audience (it is a self-selecting group, so there’s likely some skew), and the population you choose for comparison matters. But those comparisons provide a starting point for asking better questions.
And that’s the part of the work I’ve continued to develop.
What I’d do differently today
The original solution was designed around the systems Sadler’s Wells already had and what I had available to me. That was a sensible approach, and I still think the principles behind it were right.
But if I were building something similar today, I wouldn’t necessarily use the same combination of technologies.
The starting point is still looking at the systems an organisation already has, and what each of them does well.
For an organisation using Tessitura, for example, I would still expect the survey invitation to come from a platform that integrates with Tessitura, such as WordFly or Prospect2.
That’s important because the email needs to contain information that identifies the recipient’s attendance or performance, allowing the survey response to be associated with the appropriate records.
The survey itself doesn’t have to be tied to a particular system. I’d still recommend considering Jotform, which worked well for the original project. But if an organisation already uses ActionLinks, for example, that can be used instead
The same principle applies to organisations using other CRMs. If their existing email system can generate personalised survey links containing the necessary identifiers, my approach can work without Tessitura.
For the integration and automation work, I’d now use n8n rather than Power Automate. n8n provides a flexible way to connect systems, process incoming survey responses, enrich the information using other sources, and move data into the analytical environment.
But the most significant change would be in how I’d approach the reporting and analysis. Rather than building a bespoke set of Power BI reports for each organisation (and all the licensing overhead that involves!), I’d now use Datarelle.
Introducing Datarelle
Datarelle is a platform I’ve developed to help organisations bring together information from different systems and make better use of it.
My starting principle is that reporting on data from a single system is generally best done as close to that system as possible.
If you want to understand ticket sales, your ticketing system is usually the right place to start. If you want to examine fundraising activity, your fundraising CRM should already provide useful reporting. There’s little value in recreating existing functionality in another platform.
The challenge comes when the questions you want to answer require information from several different sources. Audience surveys are a good example.
The survey platform holds the responses. The ticketing or CRM system holds information about performances and attendance. Census data provides external demographic context.
Each dataset is useful individually. Bringing them together allows for more meaningful analysis.
Audience surveying in Datarelle
I’ve taken historical survey data from Sadler’s Wells and brought it into Datarelle to demonstrate how this works.
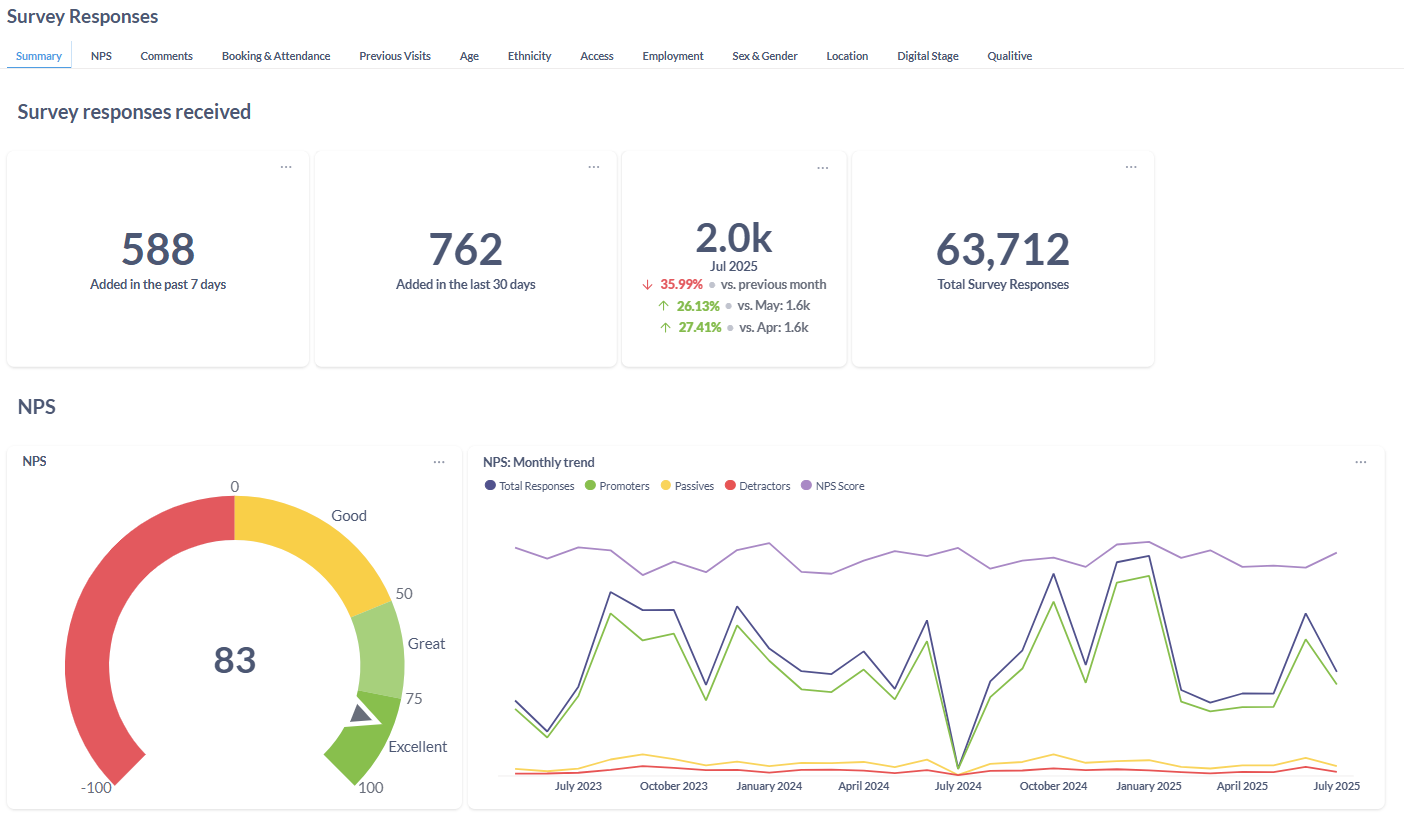
The underlying analytical principles haven’t changed. We can still look at survey responses by production, venue, date and other relevant dimensions, and combine that information with data from elsewhere.
One significant improvement is the ability to make direct comparisons between different groups of respondents.
In the original Power BI reporting I built, comparing two venues or productions meant changing filters and examining the results separately.
In Datarelle, I can put those groups alongside each other, including comparisons with relevant census data.
That makes it much easier to identify differences between audiences side-by-side, without repeatedly changing filters or exporting separate charts to compare outside the system.
And I now have the flexibility to combine multiple elements into one chart – so comparing two shows against each other (the bars) against two selections of Census data (the lines):
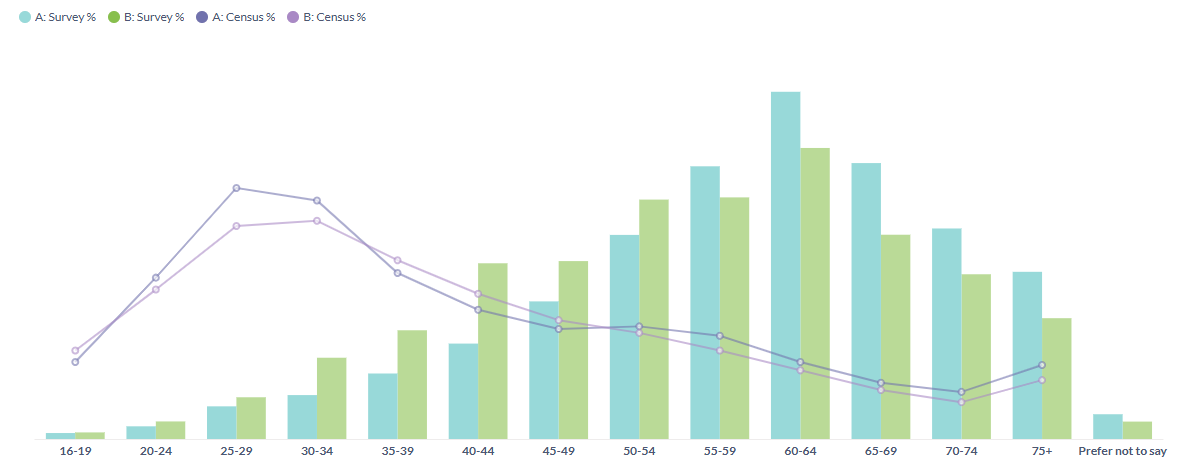
Datarelle also makes it easier to carry out comparisons that were cumbersome in the original reporting. Different venues, productions, performances or time periods can be compared directly, using the same underlying survey data. The results can also be exported for use in reports and presentations.
There’s also an important change behind the scenes. In the original Power BI approach, some of the data transformations and calculations were embedded in the reporting itself. With Datarelle, that logic sits in the underlying database, separate from the dashboards. This means calculations and definitions can be managed consistently, checked and reused across different reports, rather than potentially having different versions of the same metric in different places.
And because Datarelle isn’t designed specifically for audience surveys, that information and business logic can sit alongside other datasets within a common analytical environment, rather than requiring a separate reporting solution for each purpose.
You don’t have to replace everything
One of the things I’ve learned is that organisations are understandably reluctant to introduce yet another platform, particularly if doing so means replacing systems that already work. And they shouldn’t have to replace them unnecessarily.
An organisation might already have a successful survey process. Its CRM sends invitations, its survey tool collects responses, and staff are comfortable managing the whole thing. There’s no reason Datarelle needs to interfere with that process.
Datarelle can use the resulting data, combine it with information from the CRM and other sources, and provide additional analysis.
Alternatively, if the existing survey process involves too much manual administration, there’s an opportunity to look at the whole workflow, including survey distribution, collection, automation and reporting.
The important thing is to start with the organisation’s requirements and existing technology, rather than trying to force everything into one prescribed solution.
Beyond audience surveys
Although I’ve used audience surveys as the example here, the same approach applies much more widely.
Cultural organisations hold valuable information across ticketing, fundraising, marketing, finance, digital engagement and other systems.
Those systems generally have their own reporting capabilities, and in many cases they’re perfectly good at reporting on their own data. But organisations don’t necessarily operate within those boundaries.
A question about audience development might require information from ticketing, surveys, marketing and external demographic sources.
An organisational dashboard might need to present a small number of key measures from finance, ticketing and fundraising together, without requiring someone to open three separate systems.
And sometimes the most useful insight comes not from any single dataset, but from the relationships between them.
That’s the problem I’m trying to address with Datarelle.
Not to replace specialist systems, but to make it easier to understand the wider picture.
Different approaches to hosting and ownership
Another consideration is how organisations want to manage their data and technology.
Some want a managed service, where the infrastructure, maintenance and ongoing support are handled for them.
Others prefer to own the analytical environment themselves, with their systems and data hosted in infrastructure under their control.
Datarelle can be delivered using either approach.
For some organisations, a managed service will be the simplest and most practical option. For others, a client-owned implementation may fit better with their IT strategy, internal capabilities or requirements around data ownership and long-term independence.
I don’t think there needs to be a single answer for everyone.
The same thinking, a different approach
Looking back at the original Sadler’s Wells project, I can see a fairly direct line from that work to what I’m doing now.
The initial challenge was to make audience surveys easier to complete, easier to manage, and more useful.
That led to connecting information from different systems, automating the work of bringing it together, and adding external context to the resulting analysis. Datarelle is an extension of that thinking.
The tools have changed, and the approach is now designed to be more repeatable across organisations rather than built for one specific environment.
But the objective is much the same: make better use of the data organisations already have, without creating unnecessary work or duplicating what their existing systems do well. Audience surveys remain a useful example of that approach, but they’re only one application.
If you’re working through similar challenges in your organisation, whether around audience data or bringing together information from other systems, I’d be interested to hear how you’re approaching them.
You can find out more about Datarelle, or connect with me on LinkedIn.


Leave a Reply